Return on invested capital (ROIC) is a foundational metric in finance. Of all the ways to measure a company’s profitability, we believe ROIC provides a superior window into a company’s viability.
In this post, we explain how Boston Trust Walden uses ROIC to evaluate companies for investment, and why we generally favor it over other profitability metrics.
ROIC and Economic Profitability
From an accounting perspective, a successful business will achieve profitability by generating more sales than expenses. But from an investor’s standpoint, economic profits are what matter — meaning the firm’s ROIC should exceed its weighted average cost of capital (WACC).1
A company that is economically profitable generates profits in excess of what is required by its investors to compensate them for the risk they are underwriting in a given enterprise. A firm may achieve economic profitability by virtue of a competitive “moat” that allows for sustained pricing power; or perhaps the company has a novel way to provide a product or service at lower cost than competitors. These are desirable traits we look for in our research.
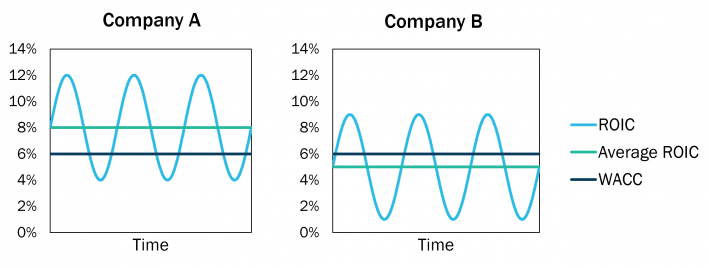
But economic profitability might also be due to a cyclical peak in a company’s business. Although this can benefit a company in the short run, we prefer to consider ROIC — and economic profitability — across the business cycle, taking into account how a company performs in periods of economic expansion and contraction. In the chart below, Company A is an example of an attractive cyclical company; its average ROIC exceeds its WACC even though it underearns its WACC at the cyclical trough. On the other hand, Company B may appear economically profitable at certain times, but does not provide an adequate return through the cycle and is, therefore, unsustainable and unattractive.

Incremental ROIC
While high ROIC is attractive, it is even better when accompanied by high incremental ROIC.2 This refers to the return generated by recent additions to a company’s capital base, which may occur when it reinvests in its business (e.g., building a new factory, acquiring a competitor). Incremental ROIC can be calculated from the financial statements by dividing the change in earnings by the change in invested capital.
In practice, however, calculating incremental ROIC over short time periods can produce noisy results. Earnings may rise or fall for reasons that have nothing to do with a company’s change in capital. In addition, returns on capital investments often lag the investment spending by a few quarters or years, depending on the size and complexity of a project. For these reasons, an assessment of the return on recent capital spending often depends on a multifaceted evaluation of the company, rather than a specific formula.
Analysts at Boston Trust Walden consider the operating environment for the company, competitive and regulatory forces, past investment successes or failures of related projects, and return hurdle rates for investment provided by company management.3 But despite the vagaries of determining incremental ROIC, the concept is critical. A high incremental ROIC implies a company continues to have economically profitable investment opportunities and growth potential, which in turn implies a higher value for the business.
What about ROE?
When evaluating a company from the perspective of an equity investor, it may seem logical that using return on equity (ROE) should be favored over ROIC. On the surface, this has some merit since ROE is focused on what is available to equity investors; it is calculated using earnings after creditors have been paid and excludes capital from creditors in the denominator. But in practice, ROE can be manipulated by a company’s use of financial leverage and can be subject to greater accounting distortions than ROIC.
At Boston Trust Walden, we are, first and foremost, concerned with investing in high quality, durable, sustainable businesses. A high ROE may be a sign of an attractive return, or it may be a sign of a risky capital structure with too much debt.4 A high ROIC, however, is a more reliable gauge of economic success of the overall firm and an important indication that it may be considered high quality.
ROIC and Equity Valuation
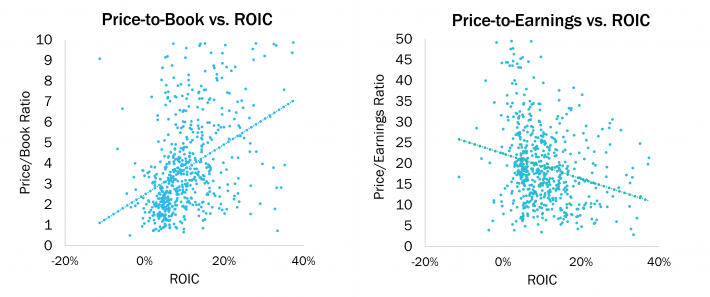
While the ROIC calculation is not directly affected by a company’s stock price, it can affect observed valuation. All else equal, a company with a higher ROIC will tend to trade at a higher price-to-book ratio. Equity investors realize that a highly economically profitable company is worth more than the book value of capital that has been invested into it. We see this empirically in the scatterplot on the left below, where each dot represents a company in the Russell 1000® Index; higher ROIC stocks tend to trade at higher price-to-book ratios.5 But while companies with higher ROIC often trade at a premium relative to others on this metric, we do not believe this makes them expensive.
Other measures of valuation are not as influenced by ROIC, such as price-to-earnings, depicted on the right below. We expect to see that Boston Trust Walden client portfolios generally show more neutral valuation multiples relative to their benchmarks on price-to-earnings and other measures aside from price-to-book.

ROIC at Boston Trust Walden
ROIC plays a significant role in Boston Trust Walden’s quality investing philosophy (read about our philosophy here). In practice, this means we use the concepts described above to measure a company’s historical and current profitability, and to evaluate whether it still has opportunities for economically profitable growth. But this is not done in isolation for each company; to find the best investment prospects we compare a company’s profitability relative to its peers and other available investment options. We also compare variability of profitability over time using the coefficient of variation (CV) of ROIC.6 Normal cyclicality notwithstanding, we prefer those companies with higher ROIC, higher economic profitability, and more stable profitability. These characteristics help companies to be more resilient, and likewise help us construct portfolios that are generally more resilient during periods of economic turbulence while performing well over time.
* * *
Defining ROIC
Despite the importance of ROIC in financial analysis, there is not a standard calculation of the metric. Analysts generally agree that earnings before interest and taxes (EBIT) should be used in the numerator, and the sum of debt plus shareholders’ equity from the balance sheet should be used in the denominator, but other important details can vary. Some questions an analyst may ask include: Should taxes be deducted from EBIT? Should cash holdings on the balance sheet be deducted from the denominator, or, on a related note, should interest income be added to EBIT? Should beginning-of-period, end-of-period, or average capital be used for the denominator? Of course, this is only a partial list of potential questions that arise when calculating ROIC.
At Boston Trust Walden, our standard calculation of ROIC is:

This definition treats cash on the balance sheet as part of the invested capital base and credits the interest income as a return on that capital. The denominator uses the average total capital over a given period.
While the formula above is our standard ROIC calculation, we remain flexible and can adjust it as needed to facilitate more meaningful evaluation of a company or other investment research.
* * *
Endnotes
1The weighted average cost of capital refers to the average return required by all of a firm’s investors (e.g., equity investors and bondholders). For example, if 30% of a company’s capital is in the form of debt, and lenders expect a 5% return, while 70% of a company’s capital is controlled by equity owners of the firm, who expect a 10% return, then the weighted average expected return is 0.3*5% + 0.7*10% = 8.5%. If the company generates a return above 8.5%, it exceeds the requirements of its investors.
2Incremental ROIC is also referred to as Return on Incrementally Invested Capital (ROIIC).
3The final item on the list is often taken with a grain of salt, as management will generally tout high return expectations on recent projects, especially while it is still too early to measure actual results.
4This is not to say that ROE or other measures of profitability should be ignored. For example, banks and other financial institutions have different business models and accounting standards that make the standard calculation of ROIC less relevant for investors. For these companies ROA and ROE, in conjunction with an assessment of balance sheet sustainability, is often preferred.
5The relationship is statistically significant at the 5% level; however, it is not a particularly strong relationship (i.e., R-squared is low) because each stock’s price-to-book valuation depends on many factors beyond simply ROIC.
6Coefficient of variation of ROIC, or CV of ROIC, is calculated as the standard deviation of ROIC observations during a given period divided by the mean of the observations during that time.